
")


Brief Introduction #
Running a store can’t be easy but with correct analytical data you can come up with strategies that help you win against your competition. Keeping this in mind MultiVendorX introduces the Advanced Vendor Report module. This module grants vendors six reports that they can use to their advantage. These reports include sales reports, product reports, category-wise reports, tax reports, stock reports, and transaction reports.
Requirements #
Configuring Store Analytics #
As store analytics is mostly to help vendors out, the admin doesn’t need to change many settings. All the admin has to do is enable the store analytics module.
Enable Store Analytics #
In order to let vendors enjoy the benefit of using comprehensive store reports, let us figure out how to enable this module.
- The first step begins with directing your cursor to the MultiVendorX Plugin. As you bring your cursor to the plugin, the MultiVendorX menu list appears
- Select Modules from the list of menu items. Once selected you shall be redirected to the Module page.
- As you land on the module page, scroll down to the analytics section.
- Under the analytics section, you will find the Store Analytics option. Toggle to enable the option and that’s all that is required.
Vendor Reports #
MultiVendorX provides its users with comprehensive analytical data that would assist them in understanding their store better and creating strategies in case of inconsistencies. To help grasp a better understanding of the Advanced Vendor Reports we will describe in detail the function usage of each report.
Report Functions #
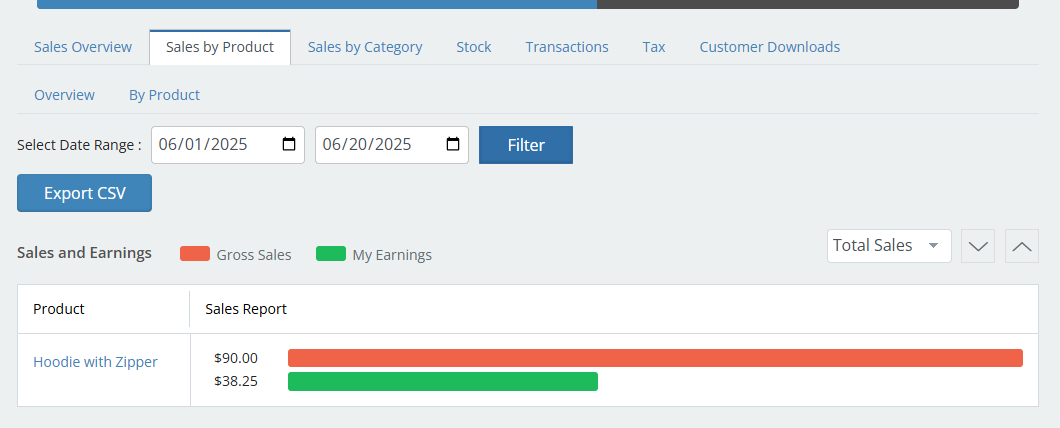
- Select Date Range – Vendors can view sales reports over a period of time by selecting the date range of the data they wish to view. This function of the Date Range not only lets vendors view the data available over a period of time but also compares reports of one time period with another.
- Export CSV – Vendors have the option of downloading Report Data by clicking on the Export CSV button. This can be useful for bookkeeping purposes.
Sales Report #
The sales report will help vendors get an idea about how their sales are progressing in the form of a graphical data chart. Some indicators used are
- Gross Sales – This sales indicator lets vendors know about the total amount of profit a vendor earns from the sale of all his products in a given time range.
- Daily Average Sales – Vendors can use this indication to learn about how they earn on a daily basis.
- Number of Orders Placed – This indicator assists the vendor in learning about the number of orders they receive in a given date range
- Net Earnings – The net earning stats will let vendors take into account the amount they earn through commissions.

Product Reports #
Having a detailed account of how a product fairs in the market is what the vendor requires to make a judgment about his shop. Depending on the sale of particular products vendors can decide whether the product is marketable or not.
- Product Report Overview – Vendors can use this information to view the gross sales of each product and the net amount they receive when all products are sold
- Product-wise Reports – Vendors can view statistical comparisons of all products sold in their shops. Depending on this data, he can see which products earn more profit than the other products. Based on this he can either increase or decrease a product price or try different strategies to increase sales.
Product Category Reports #
In a marketplace where vendors have the freedom to sell multiple categories of products, keeping track of product categories is very important. By keeping track of the product category reports vendors can plan future targets.
- Category-wise Reports – Vendors can select the category they wish to review and check the gross sales and net earnings of that category. Based on this they can plan their marketing strategies.

Stock Reports #
This category of reports gives the vendor a brief overview of their inventories. By keeping an eye on the stock along with other reports vendor plan for their future
- Low in stock – This tab show vendors a list of items they are running low on
- Out of Stock – Using this tab vendors can view items that have gone out of stock and are in dire need of restocking
- Most in Stock – Vendors can view this tab to keep track of products that are well stocked and can be skipped over when managing inventory.

Transaction Reports #
Transaction reports display the details of each exchange, withdrawal, transfer, or payment made by, or to the vendor. Indicators used to track a vendor transaction are
- Gross Credit – This key indicator lets vendors view the total amount credited to their account from the sale of all their products and services by the admin. This amount is the amount that the vendor has not withdrawn from their account.
- Average Daily Credit – This section of the transaction report shows the vendors the amount credited into their accounts on a daily basis.
- Debit of Transfer Charge – In case a vendor collects his/her commission by making a withdrawal request he/she will have to pay a transfer charge. This transfer charge is known as Debit of Transfer
- Number of Transactions – The vendor can view the total number of transactions made in the span of a given period.
- Number of Units Ordered – This refers to the number of products ordered by a customer per unit. For example a customer order 5 bottles of a product the charge incurred per bottle would be counted.

Tax Reports #
Managing taxes can be quite cumbersome but not anymore. With Advanced Vendor Reports, vendors can keep account of tax details by simply applying a Code. This code in turn will calculate Tax on the basis of a region and the region rate, without the vendor needing to wrack his brains. See how simple we make it! Now let’s take a look at how Tax by Code Function
- Tax by Code – Here the vendor can view Tax reports of a specific place or country by adding the Tax Code. By adding the Tax code note only will the Tax and rates be configured automatically but will also calculate the vendor’s sales. Based on this the Tax Log includes –
- Tax – Under this column vendors can view the Tax Code of a specific country or region
- Rate – This section calculates the rate charged under a specific code
- Number of Orders – This column manages the displays the number of products on which this tax code has been applied
- Tax Amount – The tax amount charged per product is shown in this column
- Shipping Amount – Here the vendor can view the shipping amount charged, in case it is inclusive of Tax
- Total Tax – The final amount a vendor receives when all calculations are completed
- Tax by Date – This is a simple report where vendors can view when their tax amount collected
Customer Download #
This is for Downloadable products. Unlike a simple product, Downloadable Products have unique IDs, which allows them to be tracked and logged. Under this Tab, vendors can view
- TimeStamp – Here the vendor can see the duration till which the customer can download and view the product.
- Product – Under this section vendors can view the name of the product
- File- This refers to the name of the downloaded file that the customer has purchased.
- Order – The vendor can view the order id under this section
- User – Here the vendor would be able to view the customer’s name
- IP address – The IP Address lets the vendor know the location of the customer.

With this, we come to the end of our Advanced Report Tutorial. Hope vendors can use this product to create sound strategies and make quick decisions.


