Brief Introduction #
Running a store isn’t easy, but with the right analytical insights, store owners can make informed decisions and stay ahead of the competition. Keeping this in mind, MultiVendorX introduces the Store Analytics module. This module provides store owners with essential reports to better track and optimize their performance, including product reports, category-wise reports, tax reports, and download reports—helping them make data-driven decisions to grow their business effectively.
Requirements #
Configuring Store Analytics #
The Store Analytics feature is primarily designed to assist Store Owners, so minimal configuration is required from the admin side.
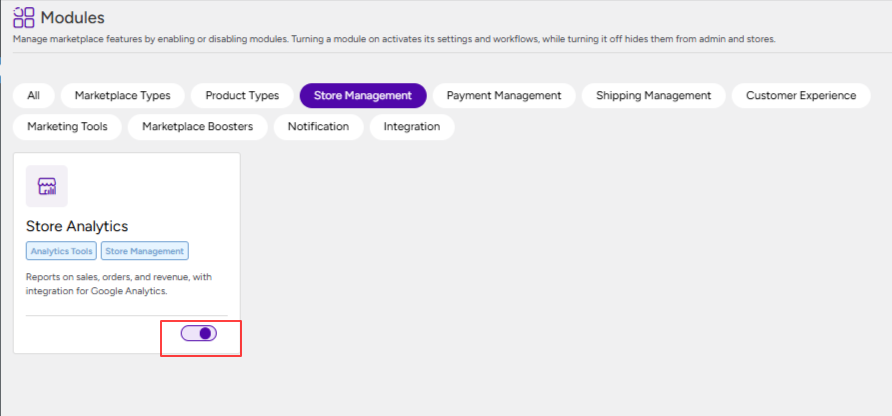
To enable the module, follow the steps below:
- Navigate to the WordPress Dashboard.
- Click on MultiVendorX from the sidebar.
- Select Modules from the submenu.
- Locate the Store Management section.
- Find the Store Analytics module.
- Toggle the module to Enable it.
Once enabled, Store Owners will be able to access and utilize analytics data from their dashboard.
Overview of Store Analytics #
Overview of Store Analytics
MultiVendorX provides comprehensive analytical data to help users better understand their store performance and make informed decisions. These insights enable Store Owners to identify trends, monitor performance, and address any inconsistencies effectively.
To help you gain a clear understanding of the available data, the following sections will explain each report and its functionality in detail.
Product Reports #
Understanding how each product performs in the market is essential for Store Owners to make informed decisions about their store. By analyzing product performance, Store Owners can evaluate whether a product is profitable, identify high-performing items, and adjust their strategies accordingly.
- Revenue vs Units Sold – This section provides a visual comparison between the total revenue generated and the number of units sold over a selected period. It helps Store Owners identify sales trends, understand demand patterns, and evaluate how product sales are contributing to overall revenue.
- Product-wise Sales Performance – This report offers a detailed breakdown of how each product is performing in terms of sales. Store Owners can compare products based on their revenue and quantity sold, making it easier to identify top-performing and underperforming products. Based on these insights, they can adjust pricing, improve marketing strategies, or optimize their product offerings to increase sales.

Product Category Reports #
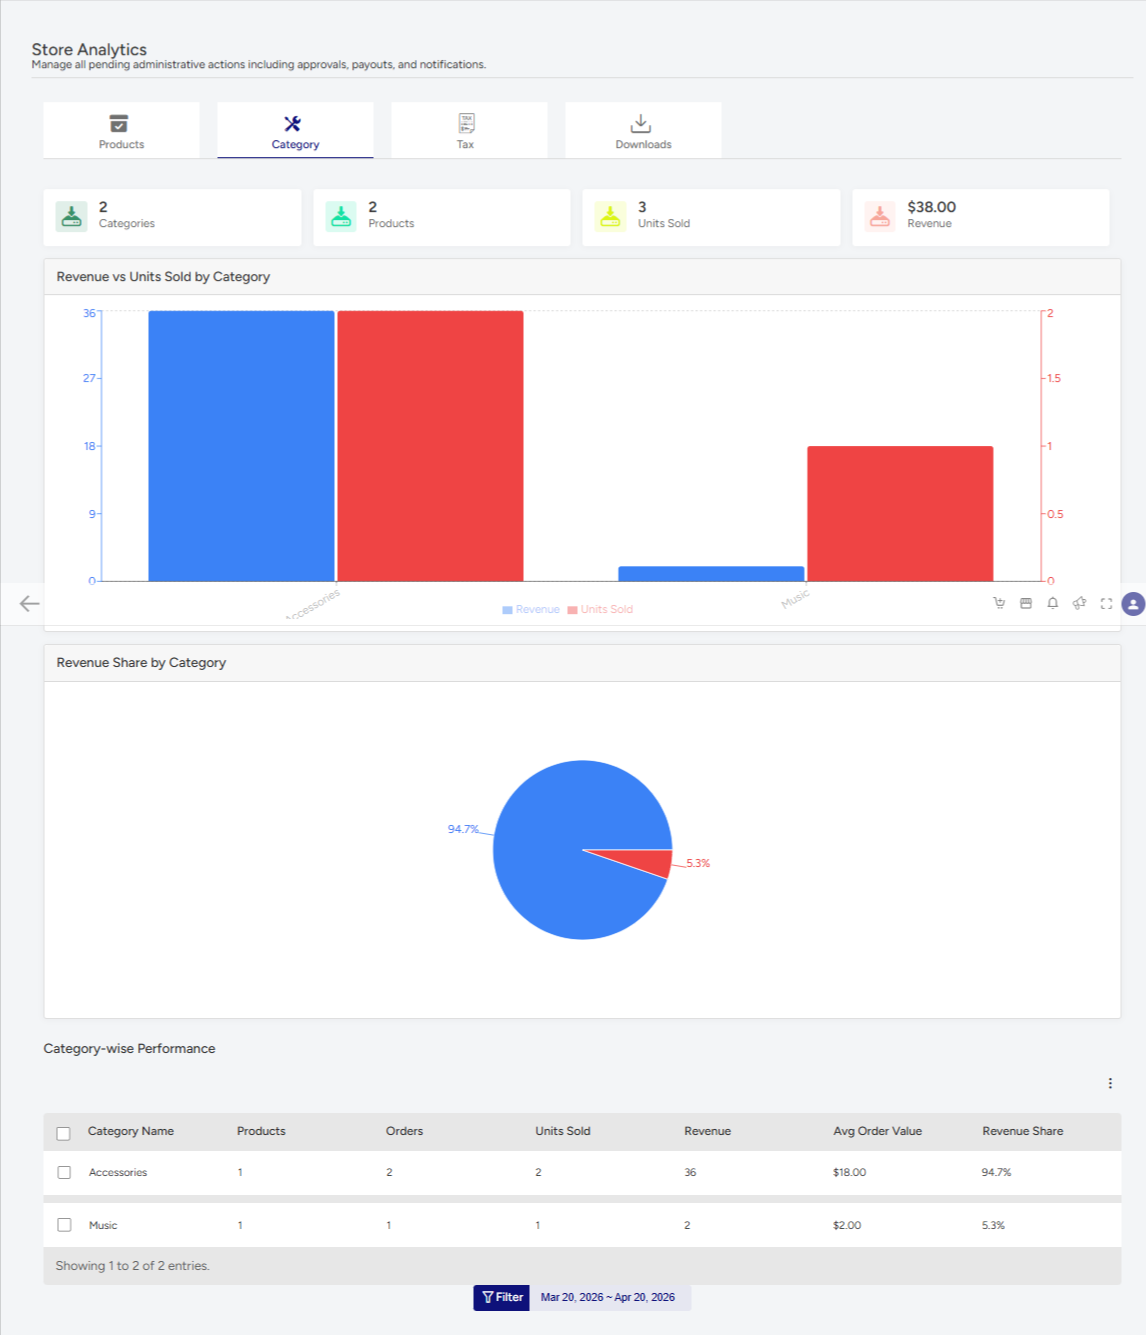
In a marketplace where Store Owners can sell products across multiple categories, tracking category-level performance becomes essential. Product Category Reports help Store Owners understand which categories are driving sales and which may require improvement, enabling better planning and strategic decision-making.
- Revenue vs Units Sold by Category
This section provides a comparison between the revenue generated and the number of units sold across different product categories. It helps Store Owners identify demand trends and understand how each category contributes to overall sales. - Revenue Share by Category
This report highlights the contribution of each category to the total store revenue. Store Owners can easily identify which categories dominate their sales and focus more on high-performing segments. - Category-wise Performance
This section provides a detailed overview of each category’s performance, including gross sales and net earnings. Based on these insights, Store Owners can refine their product mix, adjust pricing strategies, and plan targeted marketing efforts for better results.
Tax Reports #
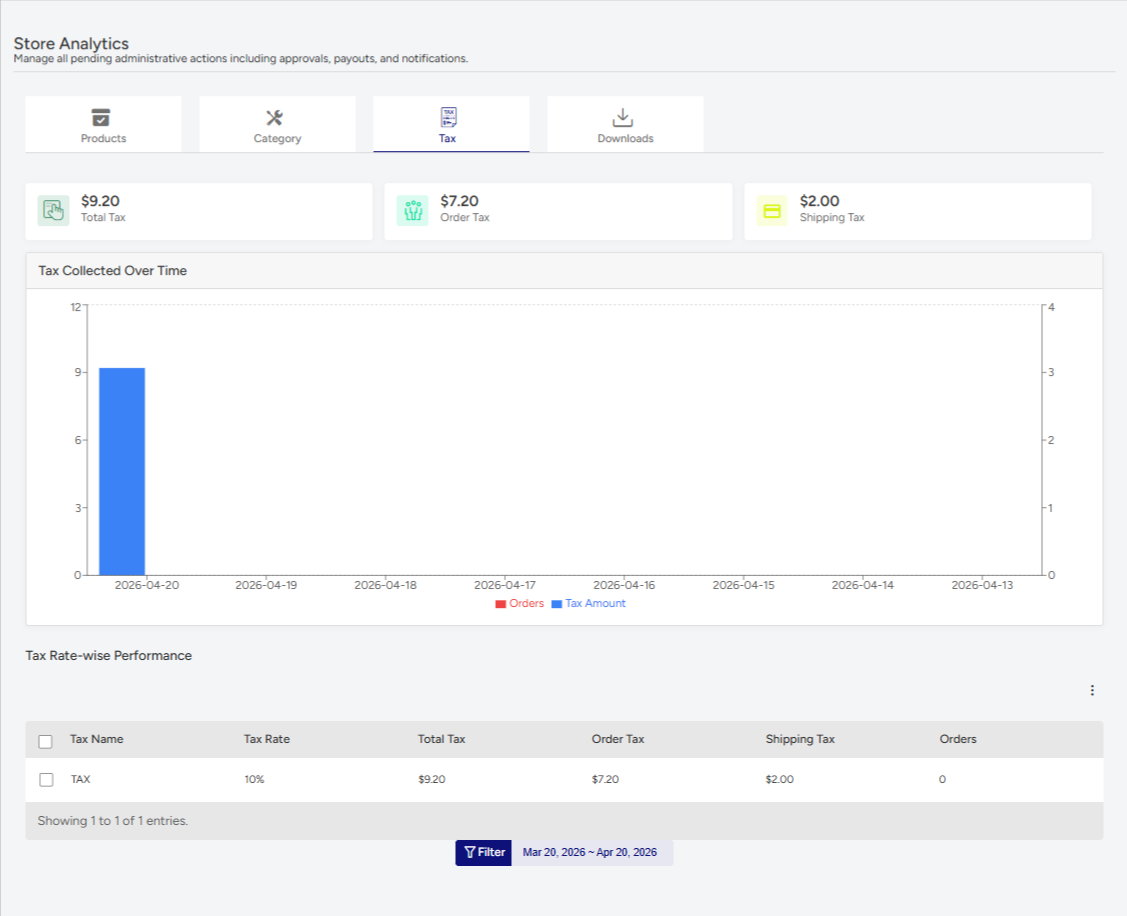
Managing taxes can often be complex, but with Store Analytics, Store Owners can get details of all the taxes related to his store orders.
- Tax Collected Over Time
This report displays the total tax collected over a selected period. It helps Store Owners monitor tax trends, identify peak periods, and maintain accurate financial records. - Tax Rate-wise Performance
This section provides a breakdown of tax collection based on different tax rates. Store Owners can analyze which tax rates contribute the most to overall tax collection and ensure proper tax configuration across regions.
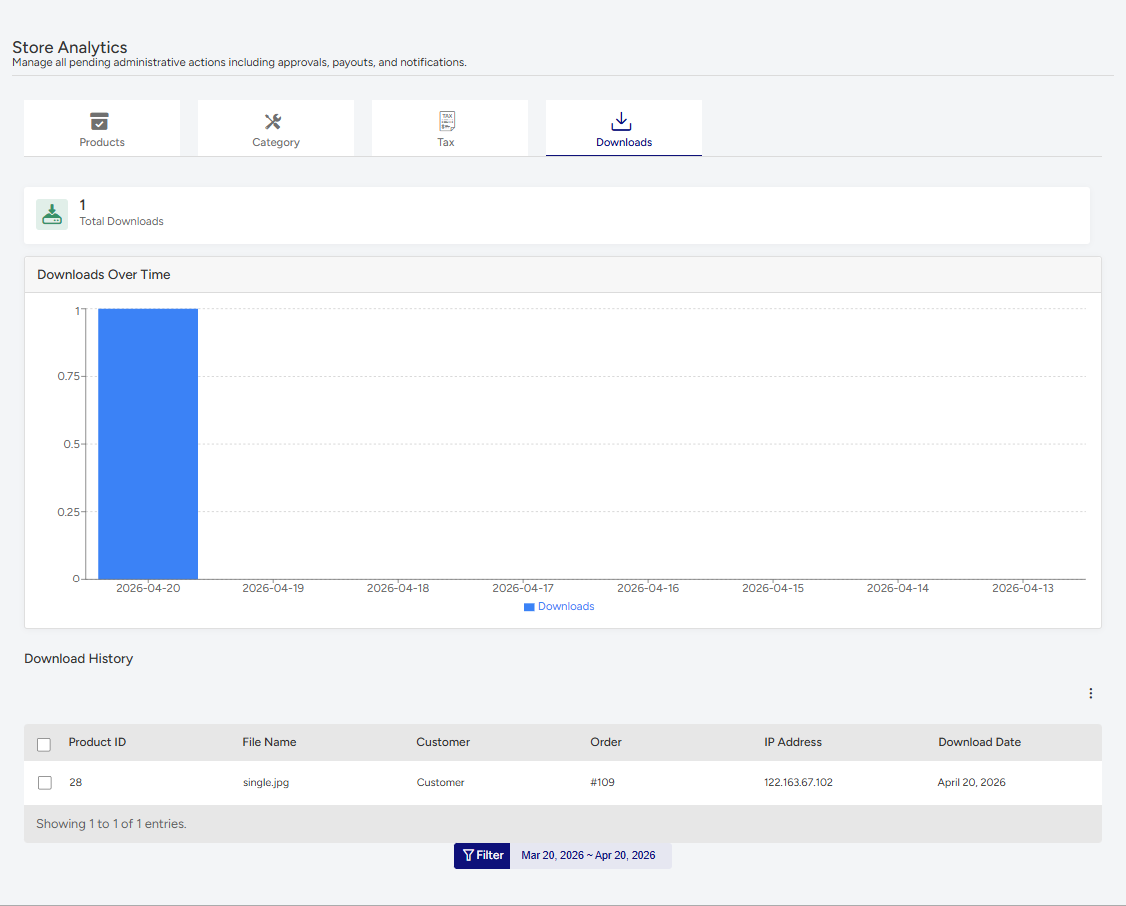
Download Report #
This is for Downloadable products. Unlike a simple product, Downloadable Products have unique IDs, which allows them to be tracked and logged. Under this Tab, store owners can view
- Product ID – Under this section store owners can view the id of the product
- File name- This refers to the name of the downloaded file that the customer has purchased.
- Customer – This section will display the customer name.
- Order – The vendor can view the order id under this section.
- IP address – The IP Address lets the vendor know the location of the customer.
- Download Date – Here the date of download date for the file will be displayed.